Tool executions
Arcade records every tool run in a , including which ran, for which end , when, and how it went, and exposes that history in the dashboard and over the API.
This page serves two jobs:
- and developers debug a run that misbehaved. The exact inputs a tool received and the outputs it returned show whether your agent sent the wrong arguments or the tool or its provider failed.
- Platform operators review what a has run, for compliance and to see which and toolkits people actually use.
cover runtime activity. For administrative changes such as creating an API key or adding a member, see Audit Logs.
What Arcade records
Each execution records:
- The and toolkit that ran, including the toolkit version
- Whether the run was immediate (on demand) or scheduled (queued to run later)
- The end it ran for
- Its status, plus the times Arcade created, scheduled, started, and finished it
- One entry per attempt, with that attempt’s success or failure, timing, and error
Arcade also records the inputs a received and the outputs it returned. Both can be large and can carry credentials or end-user data, so Arcade withholds them by default and holds them to admins. See Who can see what.
Find a run in the dashboard
Open your in the dashboard and select . The newest runs appear first.
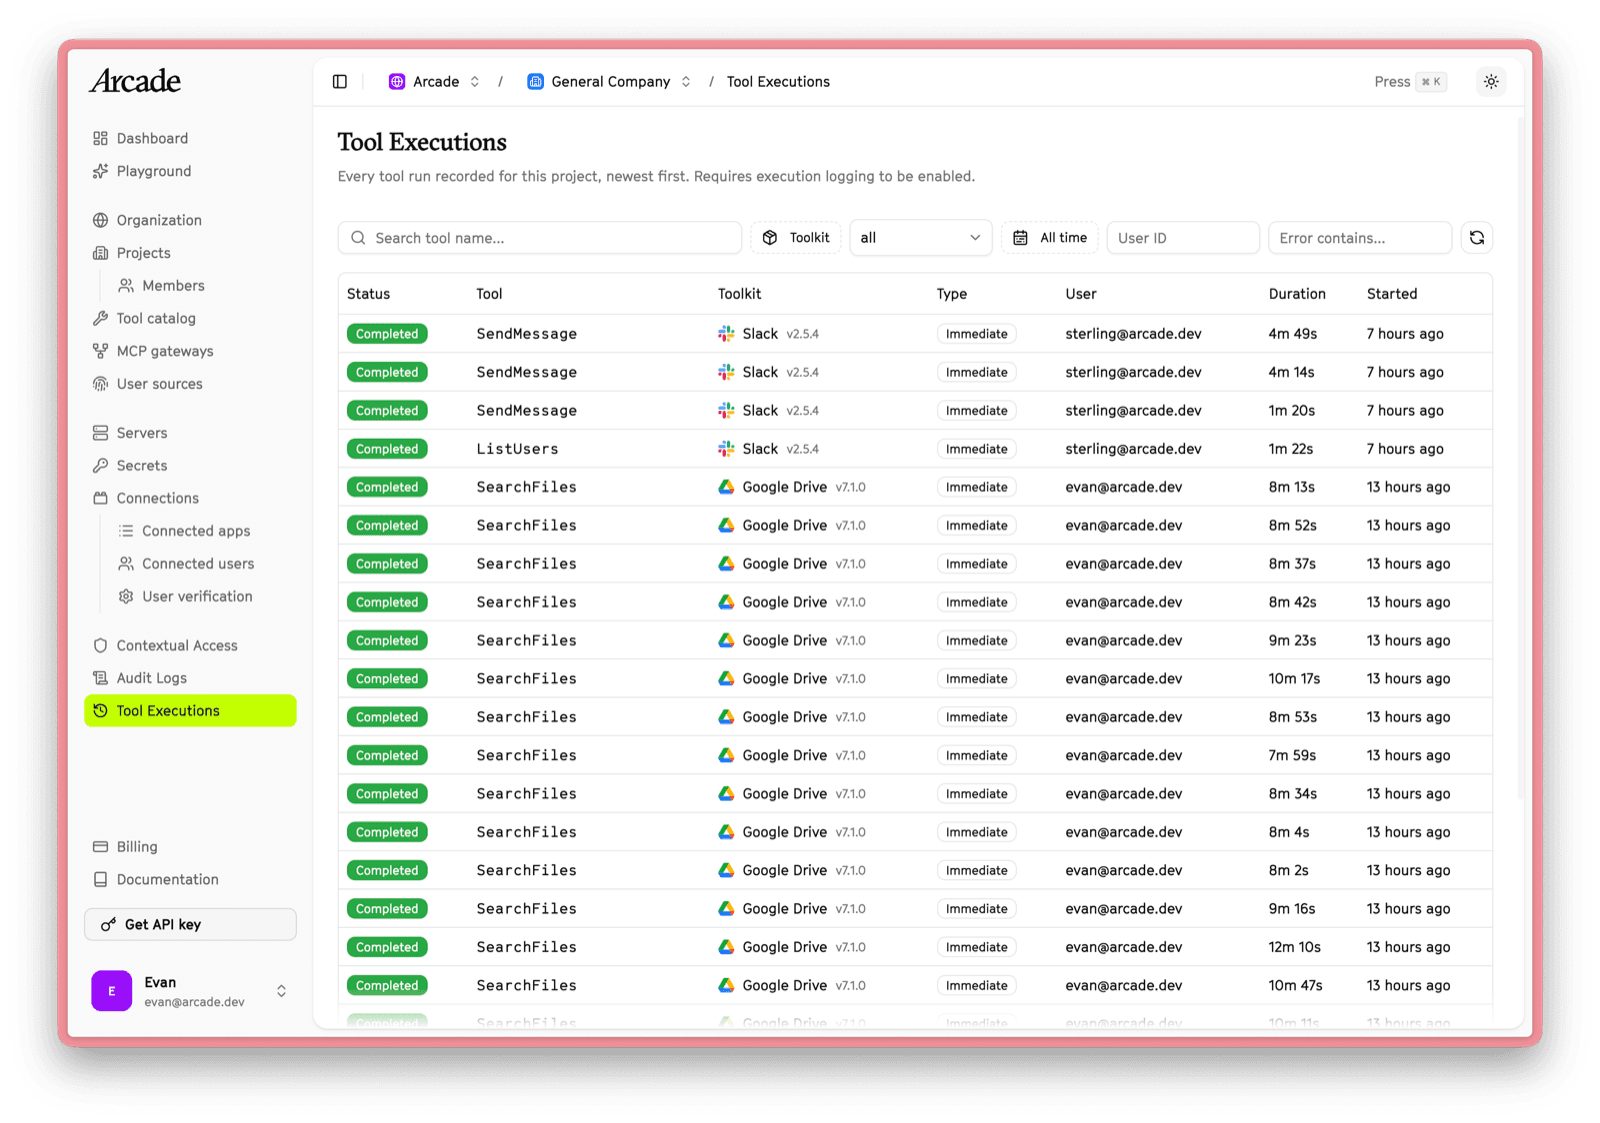
Narrow the list with these filters:
| Filter | Behavior |
|---|---|
| Search tool name | Case-insensitive substring match on the tool name |
| Toolkit | Exact toolkit name, picked from your project’s catalog |
| Outcome | All, success, or failure |
| Time range | A preset from the last hour to the last 90 days, or a custom start and end |
| User ID | The end user Arcade ran the tool for |
| Error contains | Case-insensitive match against the error an attempt reported when it failed |
Every filter lives in the URL, so a filtered view survives a reload and you can paste it to a teammate.
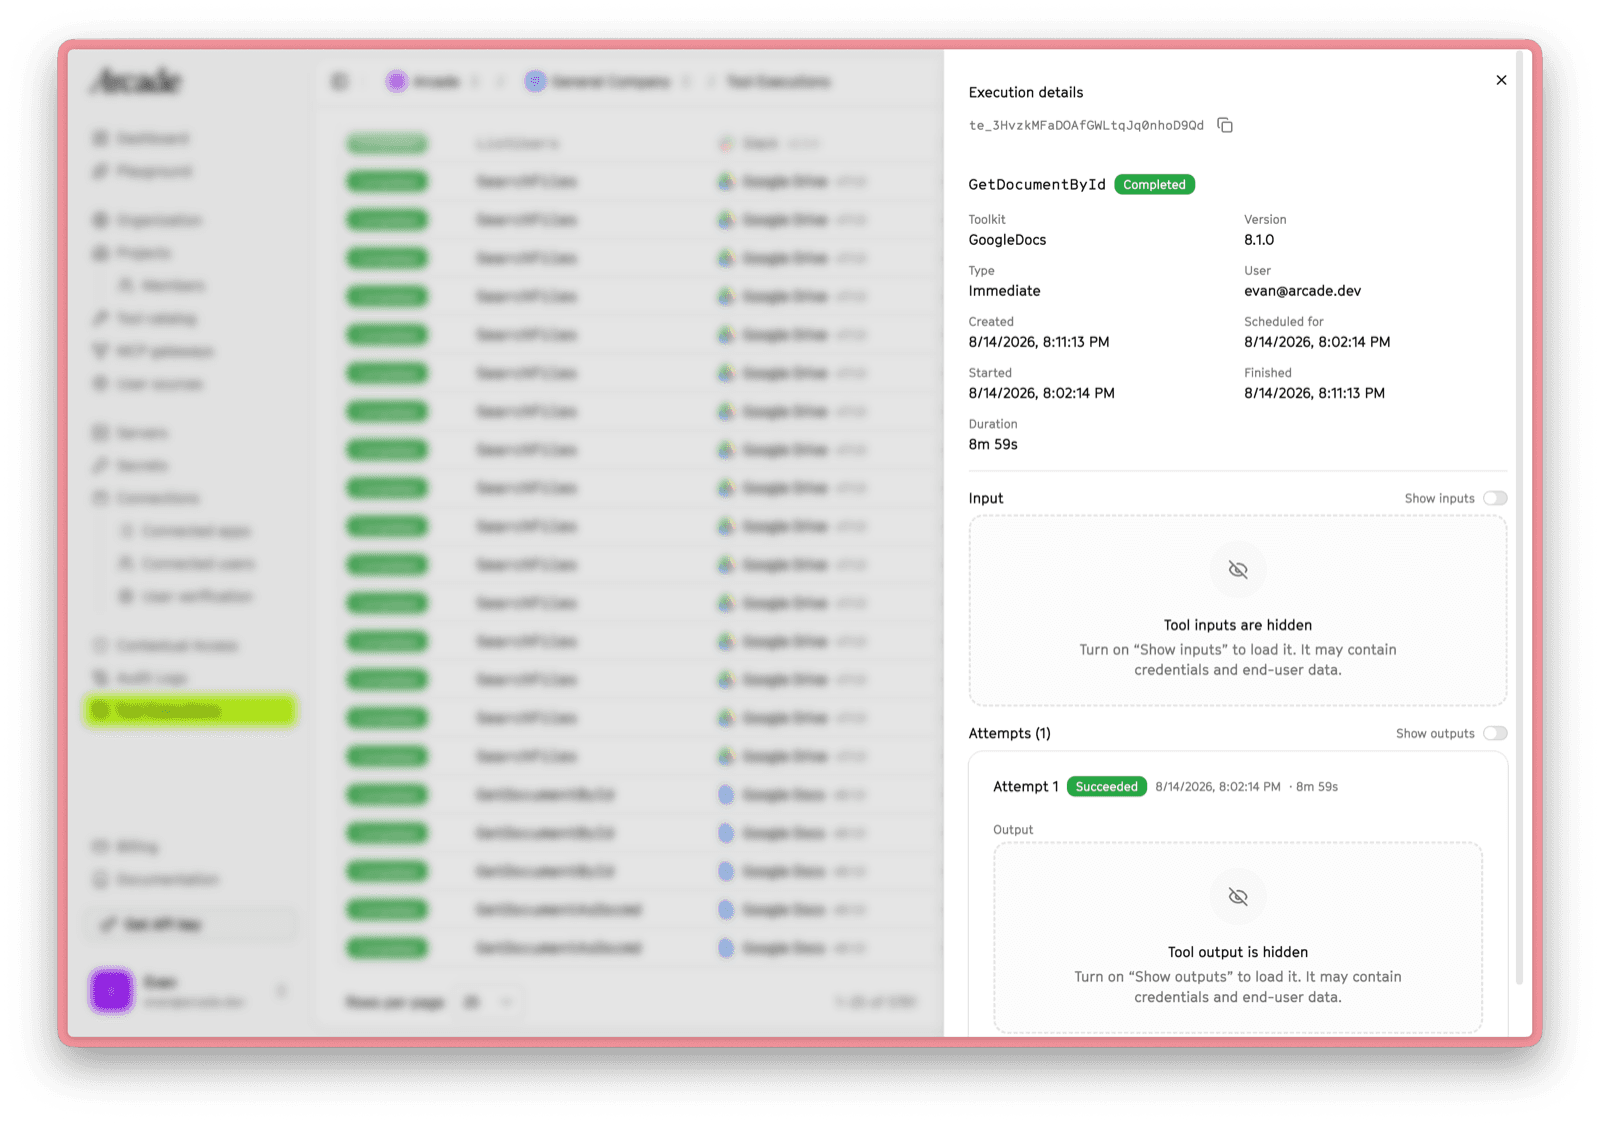
Select a row to open the execution details panel. It shows the execution ID, the and its toolkit version, the run type, the end , the full timeline, the duration, and each attempt with its status and error.
Debug a tool that isn’t working
When a tool call goes wrong, work from the record rather than from your ’s logs. The record is what Arcade actually ran.
- Set Outcome to failure, and narrow by name or by the affected .
- Open the run and read the attempt list. Each attempt shows whether it succeeded, how long it took, and the error it reported. Retries that eventually succeed point at a transient provider problem. A run that fails the same way on every attempt points at the request itself.
- Turn on Show inputs to see the exact arguments the received.
- Turn on Show outputs to see what the returned, including the full error a provider sent back.
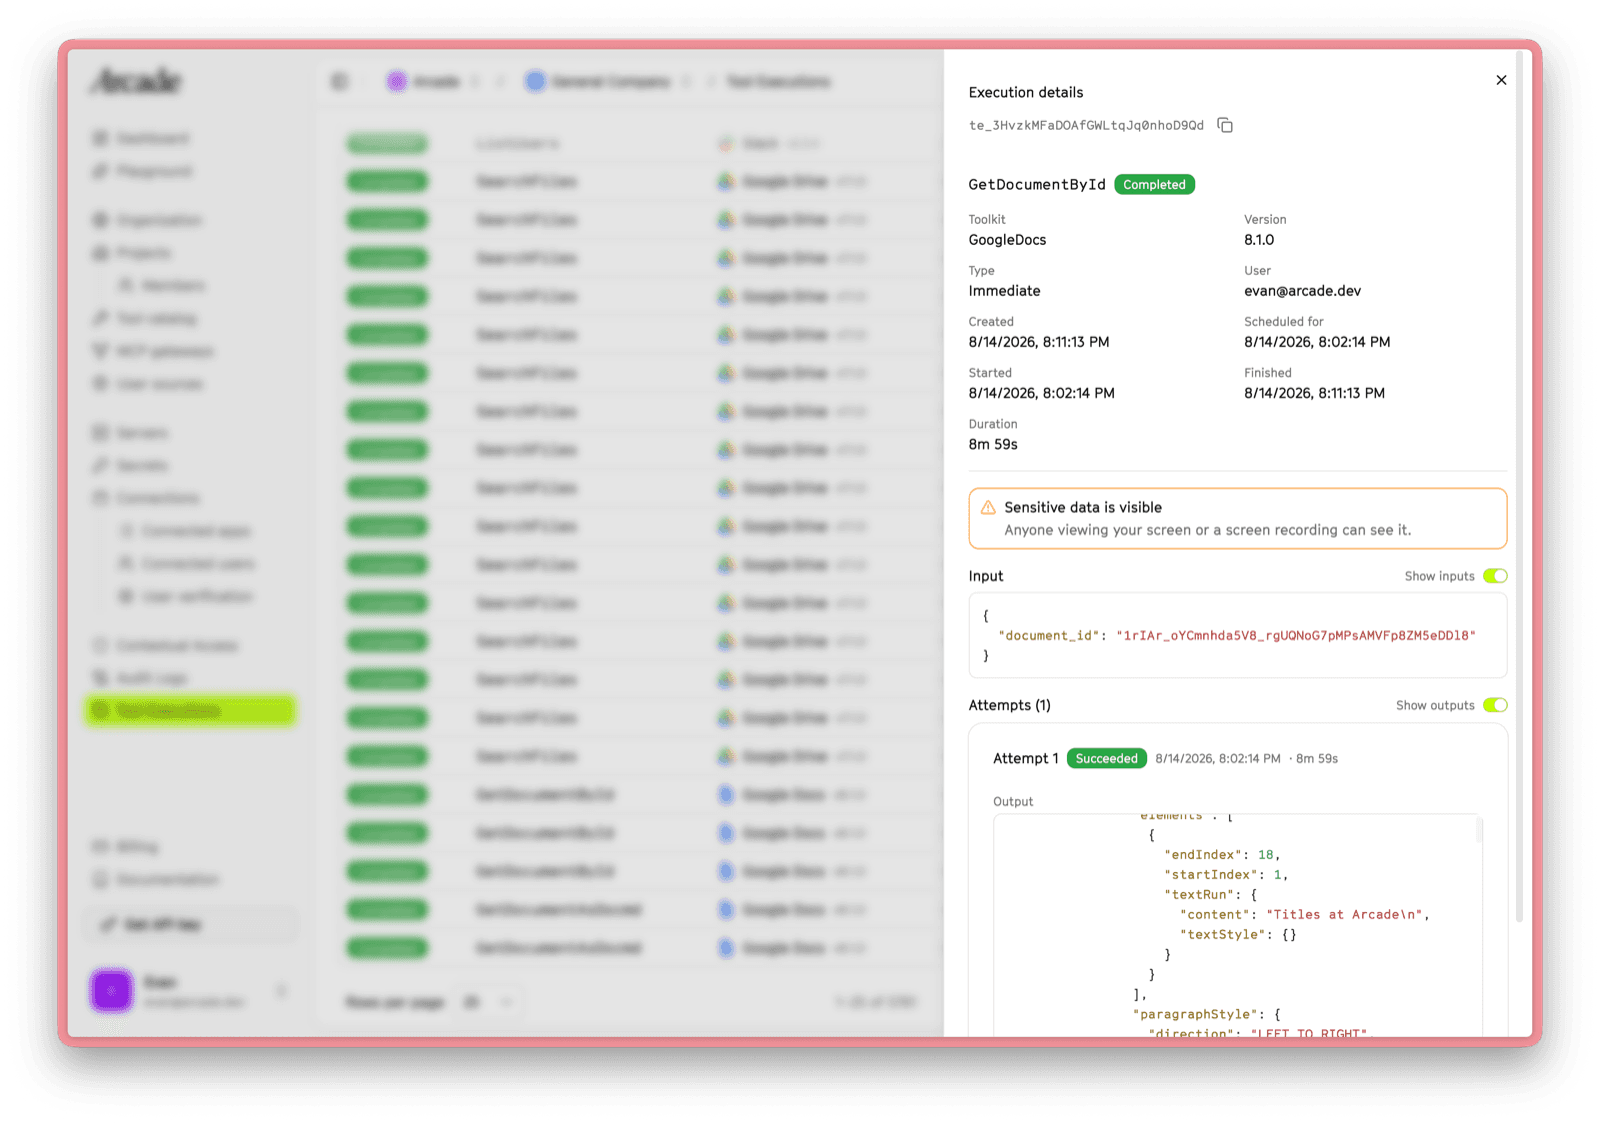
Read the two together to place the fault:
| What you see | Where to look |
|---|---|
| Inputs don’t match what you meant to send | Your agent, prompt, or harness built the wrong call |
| Inputs look right, output carries a provider error | The upstream provider, its permissions, or its rate limits |
| Inputs look right, output is wrong or empty | The tool’s own logic |
| The run needed authorization | The end user hasn’t connected the account the tool needs |
Reading inputs or outputs takes -admin authority. If the toggles won’t turn on, ask a project admin, or read the attempt errors, which stay available to every reader.
Review what a project has run
For compliance work, the list itself is the answer: every tool run in the , with the end it ran for and the outcome. Filter by User ID to produce the history for one person, or set a time range to cover an audit period. Because filters live in the URL, a scoped view is something you can share or store alongside your findings.
To see which tools people actually use, filter by or toolkit and read the total off the list, or ask the API for a count without pulling a page:
# How many times the project ran a GoogleDocs tool in the last week
curl -s "https://api.arcade.dev/v1/orgs/{org_id}/projects/{project_id}/tool_executions/count?toolkit_name=GoogleDocs&start_time=2026-08-08T00:00:00Z" \
-H "Authorization: Bearer $ARCADE_API_KEY"{ "count": 412 }Both surfaces stay scoped to a single , and neither includes inputs or outputs.
Who can see what
Anyone holding a role on the can read the history of what that project ran. The recorded inputs and outputs take project-admin authority.
| Project member | Project admin / org admin | |
|---|---|---|
| List what the project ran | ✅ | ✅ |
| Open a single run, with its tool, user, status, timing, and attempts | ✅ | ✅ |
| See why a run failed | ✅ | ✅ |
| See the inputs a tool received | ❌ | ✅ |
| See the outputs it returned | ❌ | ✅ |
Two consequences are worth knowing.
Diagnostics are not payload. The error an attempt reported when it failed, and the system error message behind a scheduler or infrastructure failure, reach every reader. A member can diagnose a failure without anyone revealing the payload. Free-form detail that a chose to attach to its error, such as a developer message, model-facing guidance, extra fields, and the stack trace, travels with the payload instead, and Arcade withholds it alongside the payload.
Revealing is deliberate. A member gets toggles they can’t switch on, rather than a permission error. When an admin turns one on, the panel warns that sensitive data is visible, since anyone watching the screen or a recording can read it. The toggle state never lands in the URL, so a shared or bookmarked link never reveals another person’s inputs on open.
Read executions from the API
The same history is available over the . The base URL is https://api.arcade.dev, and requests authenticate with a bearer token.
List the runs that failed, 25 at a time:
curl -s "https://api.arcade.dev/v1/orgs/{org_id}/projects/{project_id}/tool_executions?outcome=failure&limit=25" \
-H "Authorization: Bearer $ARCADE_API_KEY"{
"items": [
{
"id": "te_3HvzkMFaDOAfGWLtqJq0nhoD9Qd",
"created_at": "2026-08-14T20:11:13Z",
"updated_at": "2026-08-14T20:11:13Z",
"execution_type": "immediate",
"execution_status": "failed",
"tool_name": "GetDocumentById",
"toolkit_name": "GoogleDocs",
"toolkit_version": "8.1.0",
"user_id": "sterling@arcade.dev",
"started_at": "2026-08-14T20:02:14Z",
"finished_at": "2026-08-14T20:11:13Z"
}
],
"limit": 25,
"offset": 0,
"page_count": 1,
"total_count": 137
}The newest results come first, and pages advance by offset. limit defaults to 100. The list accepts tool_name, toolkit_name, user_id, outcome, failure_reason, start_time, and end_time, the same filters the dashboard exposes. Both timestamps take RFC 3339.
Open one run, and ask for the arguments and results it recorded:
curl -s "https://api.arcade.dev/v1/orgs/{org_id}/projects/{project_id}/tool_executions/{id}?include_inputs=true&include_outputs=true" \
  -H "Authorization: Bearer $ARCADE_API_KEY"
The detail response adds input and an attempts array to the fields the list returns. Each attempt carries its ID, timing, success, any output, and a system error message.
| Endpoint | Method | Description |
|---|---|---|
/v1/orgs/{org_id}/projects/{project_id}/tool_executions | GET | List the project’s executions, newest first |
/v1/orgs/{org_id}/projects/{project_id}/tool_executions/count | GET | Count the executions matching the same filters |
/v1/orgs/{org_id}/projects/{project_id}/tool_executions/{id} | GET | Read one execution and its attempts |
Two behaviors trip up API callers:
- The payload flags change the authority a request needs. Omit
include_inputsandinclude_outputsand the request needs only a role on the . Add either one and the request needs project-admin authority, so the same caller can receive200without the flags and403with them. - These endpoints serve operators and . Arcade refuses a read-only project API key, and refuses any caller whose authority comes from a single end user, such as an client.
Find your organization and IDs in the dashboard URL: /orgs/{org_id}/projects/{project_id}. For the full request and response schemas, see the API reference.
Retention
Execution logging runs by default, and each keeps its history for a bounded retention window: 7 days unless your organization sets a different default or a project overrides it. Past the window, Arcade deletes the records and they stop appearing in the history and the API.
To change the retention window, or to turn off execution logging and delete the history for your organization, contact Arcade support.
Related content
- Audit Logs: administrative actions across the platform
- Contextual Access: policies that decide whether a call runs at all
- API reference: full schemas for every endpoint